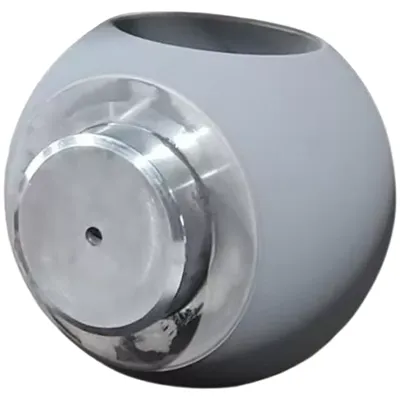
A purchasing engineer requests quotes for a 2-inch 316L valve ball, hard chrome plated, 0.4 Ra, annual volume 500 pieces. Three quotes come back: USD 38, USD 41 and USD 46. The decision looks obvious. Fourteen months later the same engineer is explaining to his operations director why the line has had six unplanned shutdowns, why incoming inspection now runs 100 percent instead of sampling, and why the assembly department has built a small rework station that nobody budgeted for.
The ball was not defective. It met the drawing. That is precisely the problem: the drawing described a geometry, not a capability, and the quote described a price, not a cost.
This article sets out a total cost of ownership framework for valve balls - the six cost layers that sit outside the unit price, where those costs physically come from in manufacturing, and how to run a defensible comparison without pretending to have data you do not have.
Two balls can pass the same drawing and still behave very differently after 20,000 cycles.
Price Is the Smallest Number in the Equation
For a typical industrial valve ball, the purchase price is usually between 20 and 40 percent of the lifetime cost the buyer actually bears. The rest is distributed across inspection, assembly, field service, inventory and - the largest and least visible item - the cost of the failures that never get attributed back to the ball.
The attribution problem is the reason price-based sourcing persists. When a valve leaks in service, the report says "seat leakage." It rarely says "ball sphericity drifted 0.008 mm outside the band because the grinder was not compensated for wheel wear." The supplier who caused the cost is not the party who receives the complaint. Until a buyer builds the bridge between field events and incoming components, the cheapest quote will keep winning on paper.
The Six Cost Layers of a Valve Ball
Every valve ball carries six cost layers. Only the first one appears on the purchase order.
| Cost layer | What it contains | How it scales with quality |
|---|---|---|
| 1. Unit price | Piece price, coating, packaging, freight | Falls as supplier capability rises - this is the only layer that moves the "wrong" way |
| 2. Incoming inspection | Sampling versus 100 percent checking, gauge time, quarantine handling, documentation review | Inconsistent suppliers force 100 percent checking; a capable supplier allows skip-lot sampling |
| 3. Assembly rework | Seat fitting, lapping, re-test, scrap of paired seats, line stoppage | Rework rate is roughly the visible half of a hidden capability problem |
| 4. Field failure | Teardown, lost production, replacement parts, labor, warranty credit, reputational cost with the end user | Dominates everything else; a single event can exceed the annual price difference |
| 5. Inventory and lead time | Safety stock carried because lead time is long or unreliable, capital tied up, obsolescence | Reliable lead time reduces buffer; erratic lead time forces buyers to hold stock for two suppliers |
| 6. Engineering overhead | Time spent chasing deviations, re-approving lots, re-qualifying, handling corrective actions | Invisible in any ERP report, but it is real engineering capacity diverted from new products |
Layers four through six are the ones that decide whether a sourcing decision was good. They are also the ones nobody puts in the comparison spreadsheet, because they are estimates rather than invoices.
A Worked Example
The numbers below are illustrative - they are a model, not a case record. The point is the shape of the arithmetic, not the specific values. Substitute your own failure cost and the conclusion will either survive or collapse, and either outcome is useful.
| Line item (500 pcs/year) | Supplier A (USD 38) | Supplier B (USD 46) |
|---|---|---|
| Purchase price | 19,000 | 23,000 |
| Incoming inspection (0.25 h/pc at USD 40/h, 100% vs sampling) | 5,000 | 600 |
| Assembly rework (3.5% vs 0.8% at USD 120/event) | 2,100 | 480 |
| Field failures (1.2% vs 0.4% at USD 2,800/event) | 16,800 | 5,600 |
| Inventory carrying (90-day vs 45-day lead time, 25%/year) | 1,170 | 720 |
| Total annual cost | 44,070 | 30,400 |
The 21 percent price premium buys a 31 percent reduction in total cost. Note where the swing comes from: not from the USD 4,000 price difference, but from the USD 11,200 difference in field failure exposure. If that failure cost were USD 400 instead of USD 2,800 - a non-critical water service valve with easy access - the cheap ball would win comfortably, and correctly.
This is the honest conclusion of any TCO exercise: the right answer depends on the cost of failure in your specific application. A supplier that tells you quality always justifies a premium is selling, not advising.
The comparison only becomes decision-grade when failure cost is given a number.
Where the Hidden Cost Physically Comes From
Total cost is an accounting view. Underneath it are five manufacturing realities that separate a ball that passes inspection from a ball that lasts.
1. Sphericity drift, not diameter error
A ball can measure 50.800 mm at the equator and still be 0.01 mm out of round. Diameter is easy to control and easy to measure; sphericity is what determines how the ball seats, how the seal loads, and how leakage develops over cycles. A supplier that reports only diameter is telling you the easiest half of the story.
2. Hardness uniformity across the surface
Case depth and hardness that vary between the pole and the equator create a wear differential. The softer zone becomes the leak path. Average hardness on a certificate can be perfectly acceptable while the minimum is not - which is why the specification should ask for a range and a sampling plan, not a single reading.
3. Coating thickness distribution
Electroplated and thermal-spray coatings do not deposit evenly on a sphere. Thickness at the poles commonly runs higher than at the sealing band, and it is the sealing band that wears. Thickness measured at a convenient point can be 40 percent above the value at the point that matters.
4. Material lot consistency
Two heats of 316L can both conform to the standard and still machine and polish differently, because inclusion content and chemistry within the allowed band affect surface finish and coating adhesion. Suppliers who buy on price from spot markets introduce lot-to-lot variation that shows up months later as inconsistent leakage rates.
5. Measurement capability
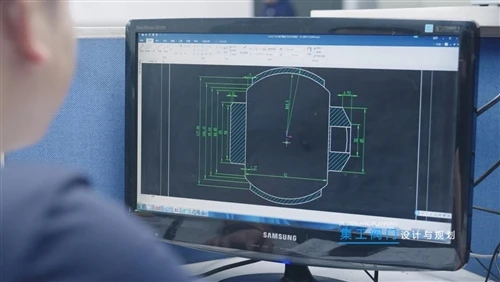
A supplier cannot hold a tolerance it cannot measure. Gauge repeatability and reproducibility on a 0.005 mm sphericity callout is a genuine engineering problem, not a formality. When a shop reports 0.002 mm capability using a handheld micrometer, the number is arithmetic, not measurement.
Sphericity measurement is where a supplier's real capability becomes visible.
How to Run a TCO Comparison in Five Steps
Step 1: Assign a cost to one field failure
Use your own service records: labor hours, lost production per hour, replacement parts, and any customer credit. A single number - even a rough one - converts the whole exercise from opinion to arithmetic. If you have no data, ask your service team for the last three teardowns and use the average.
Step 2: Normalize the specification
Compare quotes against one specification you wrote, not against each supplier's interpretation. If two suppliers are quoting different sphericity, coating thickness or material condition, you are comparing different products and the price difference is meaningless.
Step 3: Request capability data, not certificates
Ask for Cpk on sphericity, hardness distribution across the surface, coating thickness at the sealing band, and the gauge used to verify each. A supplier who can produce this data in a day has it already; one who needs three weeks is assembling it for you.
Step 4: Model three years, not one
Failure cost compounds: a supplier with a drifting process tends to get worse as tooling wears and attention moves to newer work. A one-year comparison flatters the cheap option; a three-year view with a modest deterioration assumption is closer to reality.
Step 5: Tier your portfolio
Not every ball deserves the same analysis. Split your range into critical (high cycle count, hazardous media, inaccessible location, warranty exposure) and non-critical. Apply rigorous TCO to the first group and simple price comparison to the second. This keeps the analysis affordable and directs attention where failure actually hurts.
Seven Questions That Expose the Real Cost
These are the questions that separate a supplier who understands cost from one who understands price. Ask them in the same conversation and listen to how specific the answers are.
- What is your Cpk on sphericity, and on which gauge?
- Where on the ball do you measure coating thickness, and what is the minimum at the sealing band?
- What is the hardness range across the surface, not the average?
- Which mill and which heat does this material come from, and can you show the certificate for the lot you will ship?
- What is your rework and scrap rate on this part number, and what causes most of it?
- How do you compensate for grinding wheel wear across a production run?
- If a lot drifts, how do you detect it before it ships?
A supplier who answers these with numbers and names is telling you that its process is instrumented. One who answers with assurances is telling you something else, and it is also useful information.
Capability data, not certificates, is what makes a cost comparison decision-grade.
What a Capable Supplier Looks Like From the Inside
The framework above only works if capable suppliers exist to be compared. In practice, the difference is structural rather than attitudinal: a supplier that owns its critical processes can hold a cost position that a broker cannot.
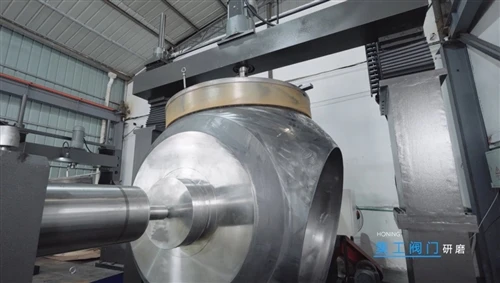
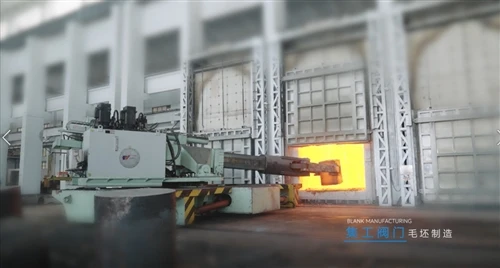
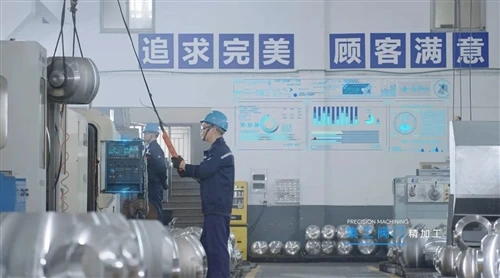
At our facility in Wenzhou - 4,000 square meters, a team of more than 70, over 200 pieces of equipment, working to 0.001 mm - the processes that determine valve ball lifetime are in-house rather than outsourced: machining and grinding, electroless nickel plating, hard chrome plating, tungsten carbide HVOF spraying and Stellite overlay welding. Materials are traceable to heat number, dimensional inspection runs on coordinate measuring equipment rather than handheld gauges, and the quality system is certified to ISO 9001. Service temperature range runs from -196°C to 500°C depending on material and coating selection.
That structure is why we can answer the seven questions above with data instead of assurances - and why we are comfortable telling a buyer when a cheaper ball is the right choice for their application.
Frequently Asked Questions
Is the cheapest valve ball always the wrong choice?
No. For low-cycle, accessible, non-hazardous service where a leak is an inconvenience rather than an event, the price-optimized ball is often correct. The framework exists to identify where that logic stops applying, not to justify a premium everywhere.
How large a price premium is justified?
As a working rule, the premium is justified when it is smaller than the expected reduction in failure, inspection and rework cost. If the premium is 20 percent and the modeled total cost falls 30 percent, it is justified. If the modeled total cost falls 5 percent, it is not - and the buyer should say so rather than pay for reassurance.
We do not track failures by component. Where do we start?
Start with three numbers from your service team: average teardown hours, production value lost per hour of downtime, and parts replaced per event. Those three produce a usable failure cost in an afternoon. Precision improves later; the decision does not need to wait for perfect data.
Does a higher price guarantee better quality?
No. Price correlates with process structure, not with outcomes. A high price can reflect a small order quantity, a trading layer, or an inefficient shop just as easily as a controlled process. That is why the seven questions matter more than the number on the quote.
How often should a TCO comparison be repeated?
Re-run it when the application changes, when a supplier changes ownership or process, or when field failure data shifts materially. Otherwise an annual refresh on critical part numbers is sufficient - the goal is a defensible decision, not a permanent analysis project.
In-house control of grinding, coating and inspection is what makes cost predictable.
Compare Total Cost, Not Just Unit Price
Send us the drawing and the operating conditions - material, medium, pressure, temperature, cycle expectation and annual volume. We will return a quotation that states the capability behind each line: sphericity, hardness distribution, coating thickness at the sealing band, and the gauge used to verify them. That gives you what a price comparison never can: the information to decide whether the premium is worth paying, in your application, on your numbers.
Request a capability-backed quotation
Zhejiang Jigong Valve Co., Ltd. - valve ball manufacturing for industrial valve makers and OEM projects.